Weather center
 simple little breadboard project combining a bunch of sensors with a raspberry pi and graphing the results.
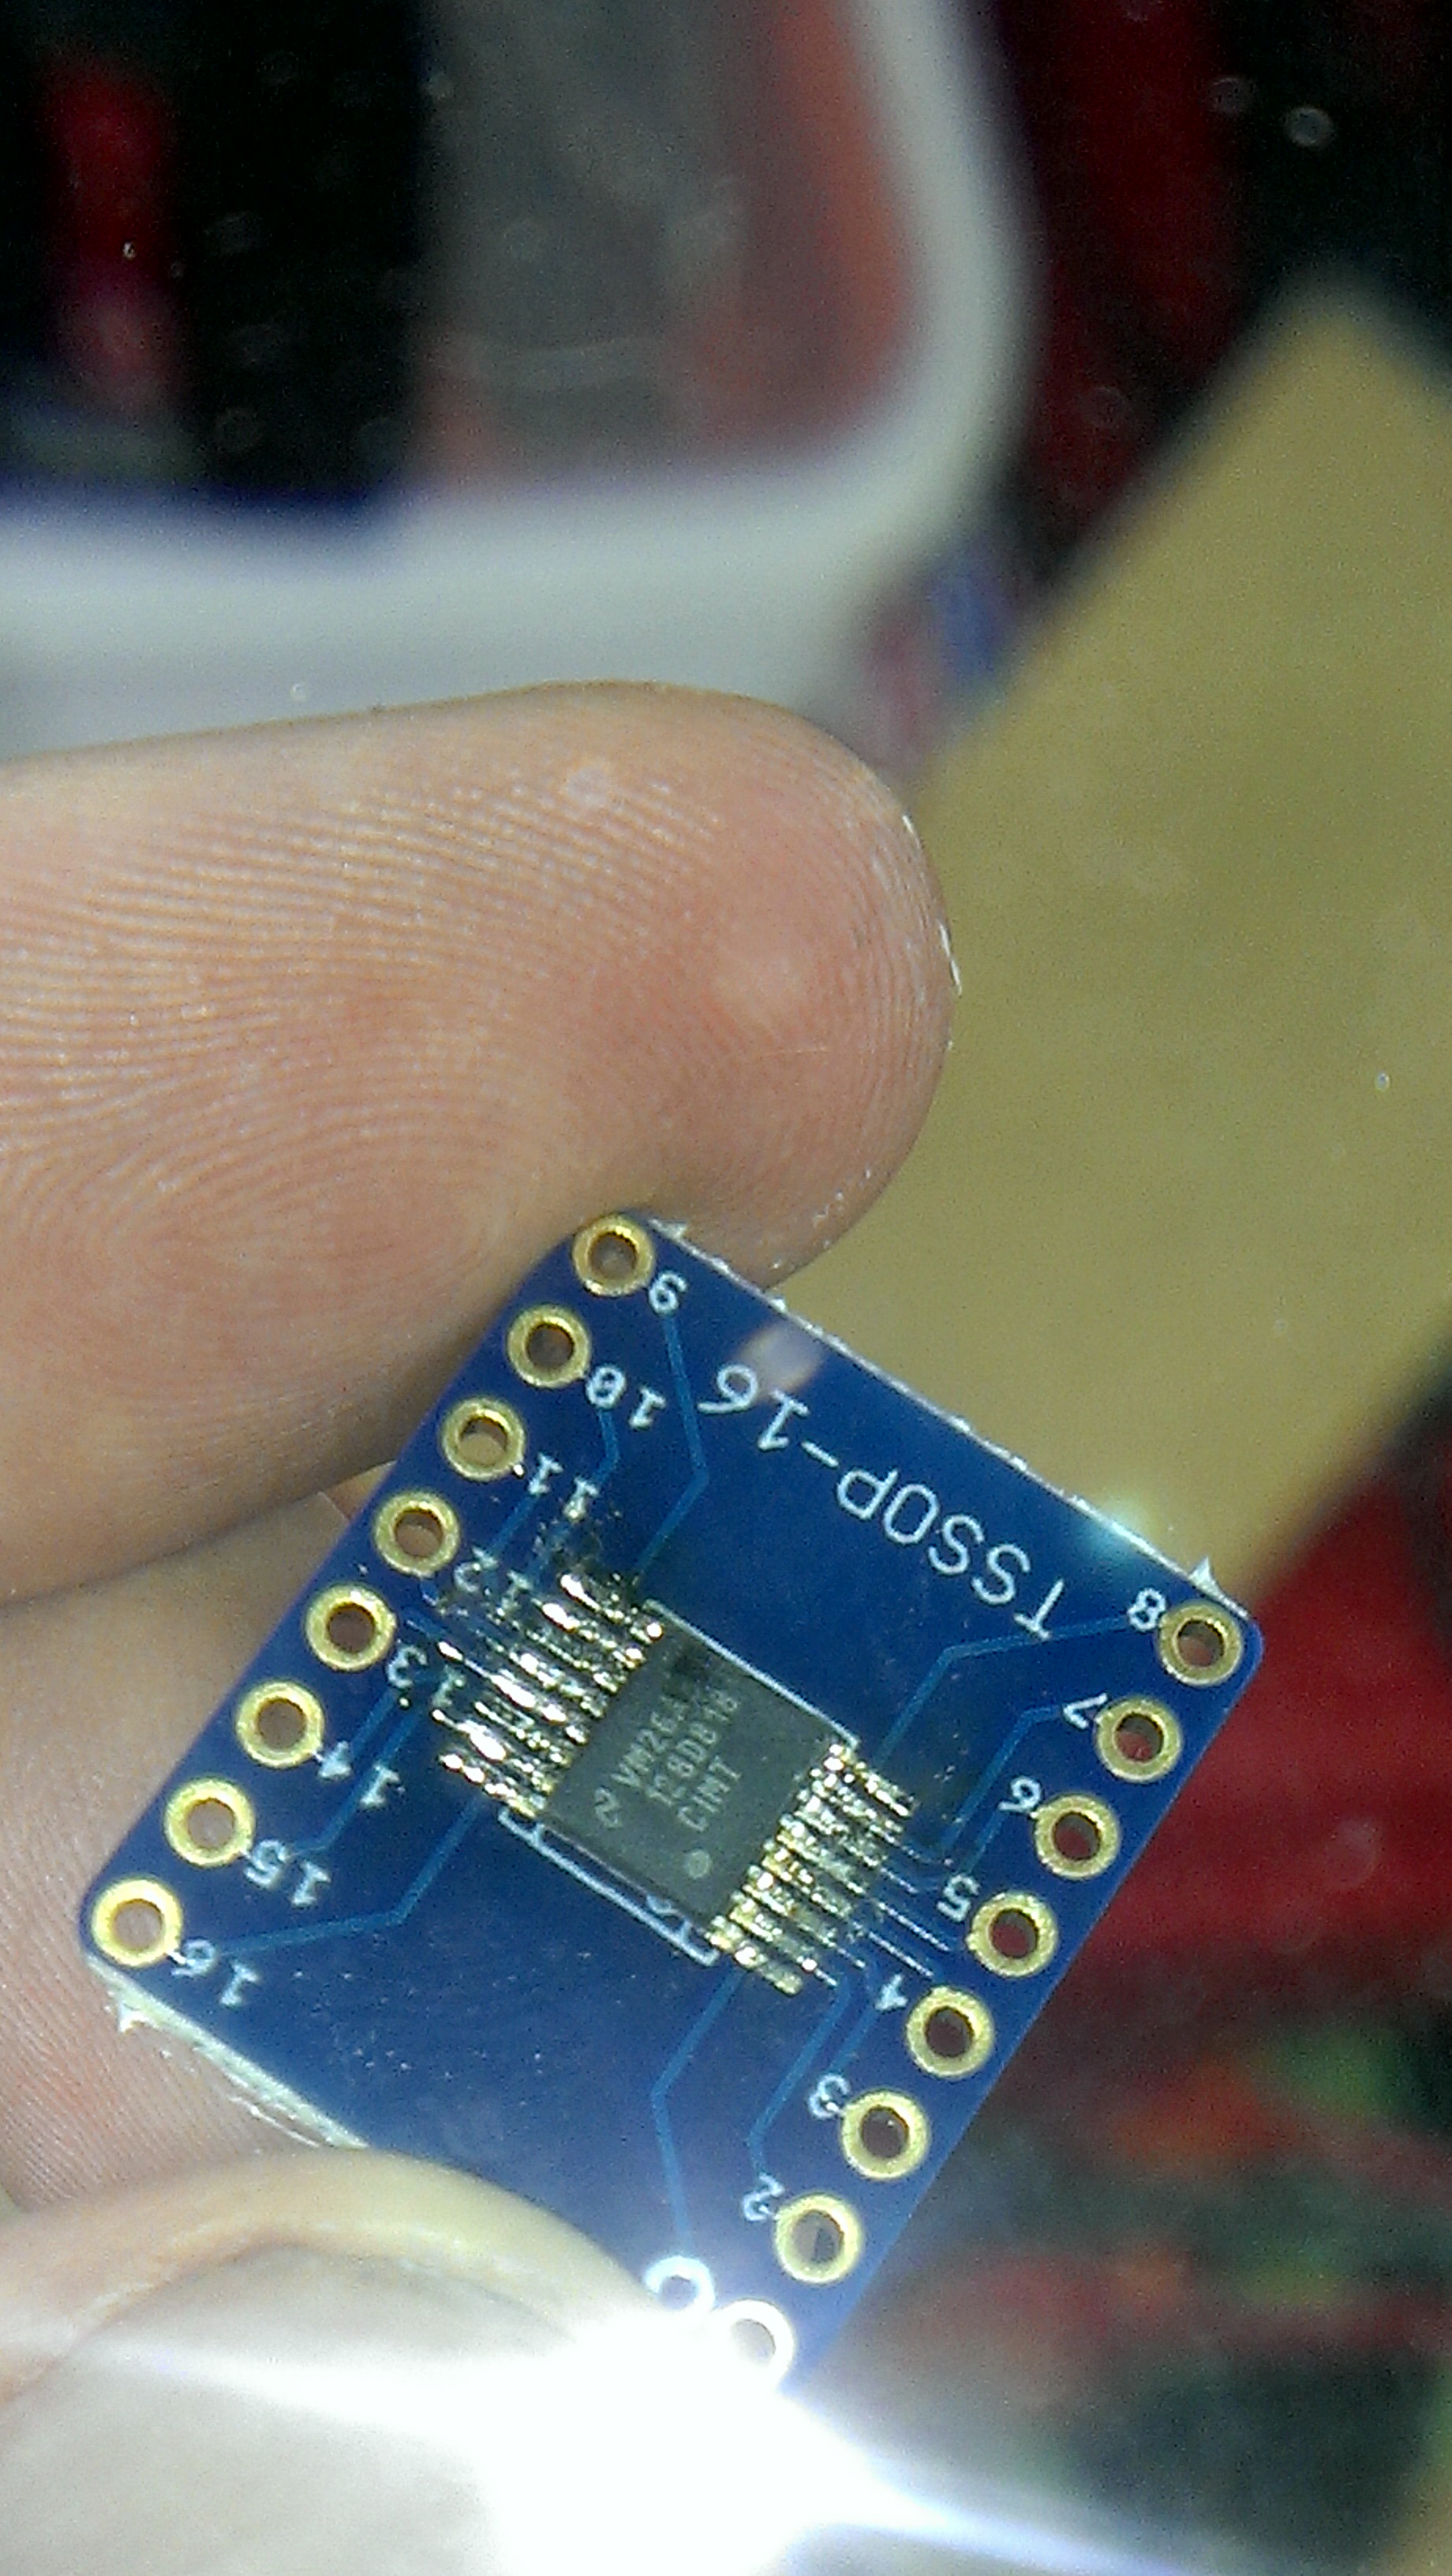
The the sensors pictured are the bmp085 barometric pressure sensor and the HIH-6130 humidity sensor, both from sparkfun. Ive since figured out the dark art of surface mounted soldering and ordered a bunch of break out boards for all the standard sizes from adafruit. so hopefully buying cheap components on a red break out board for a lot of money is a thing of the past.
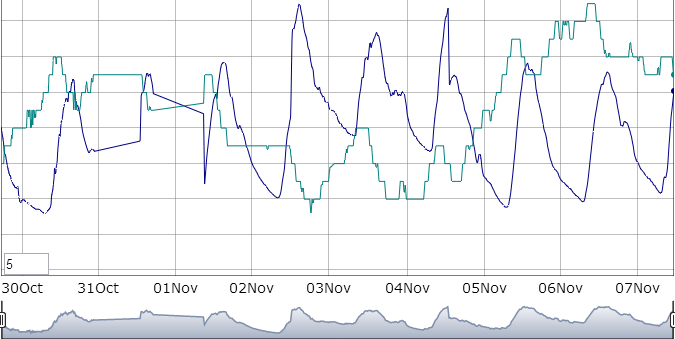
The raspberry pi is hosting the graph (dygraph js library) on its own web server.
A simple python script runs once every 5 minutes and poles the sensors over the GPIO pins, the two sensors are communicate via i2c, so its simple, but i have several gas sensors and a particle counter that return analog data (which the raspberry pi doesnt natively support) i ive started preparing an i2c analog to digital converter for them.
Work remaining:
- i need to handle the job as a linux cron job rather than python schedule (to make it less prone to failure)
- i need a good way to manage the gas the gas sensors, as they require little elements to be heated and will eat a moderate amount of power.
- solar power would be great, but this will require me learning the magic behind muli cell lithium charging and ruthless power management.
- depending on how cumbersome the csv log file becomes, i may need to roll it over to a database.
Leave a Reply
You must be logged in to post a comment.