concept tabletop global data visualisation
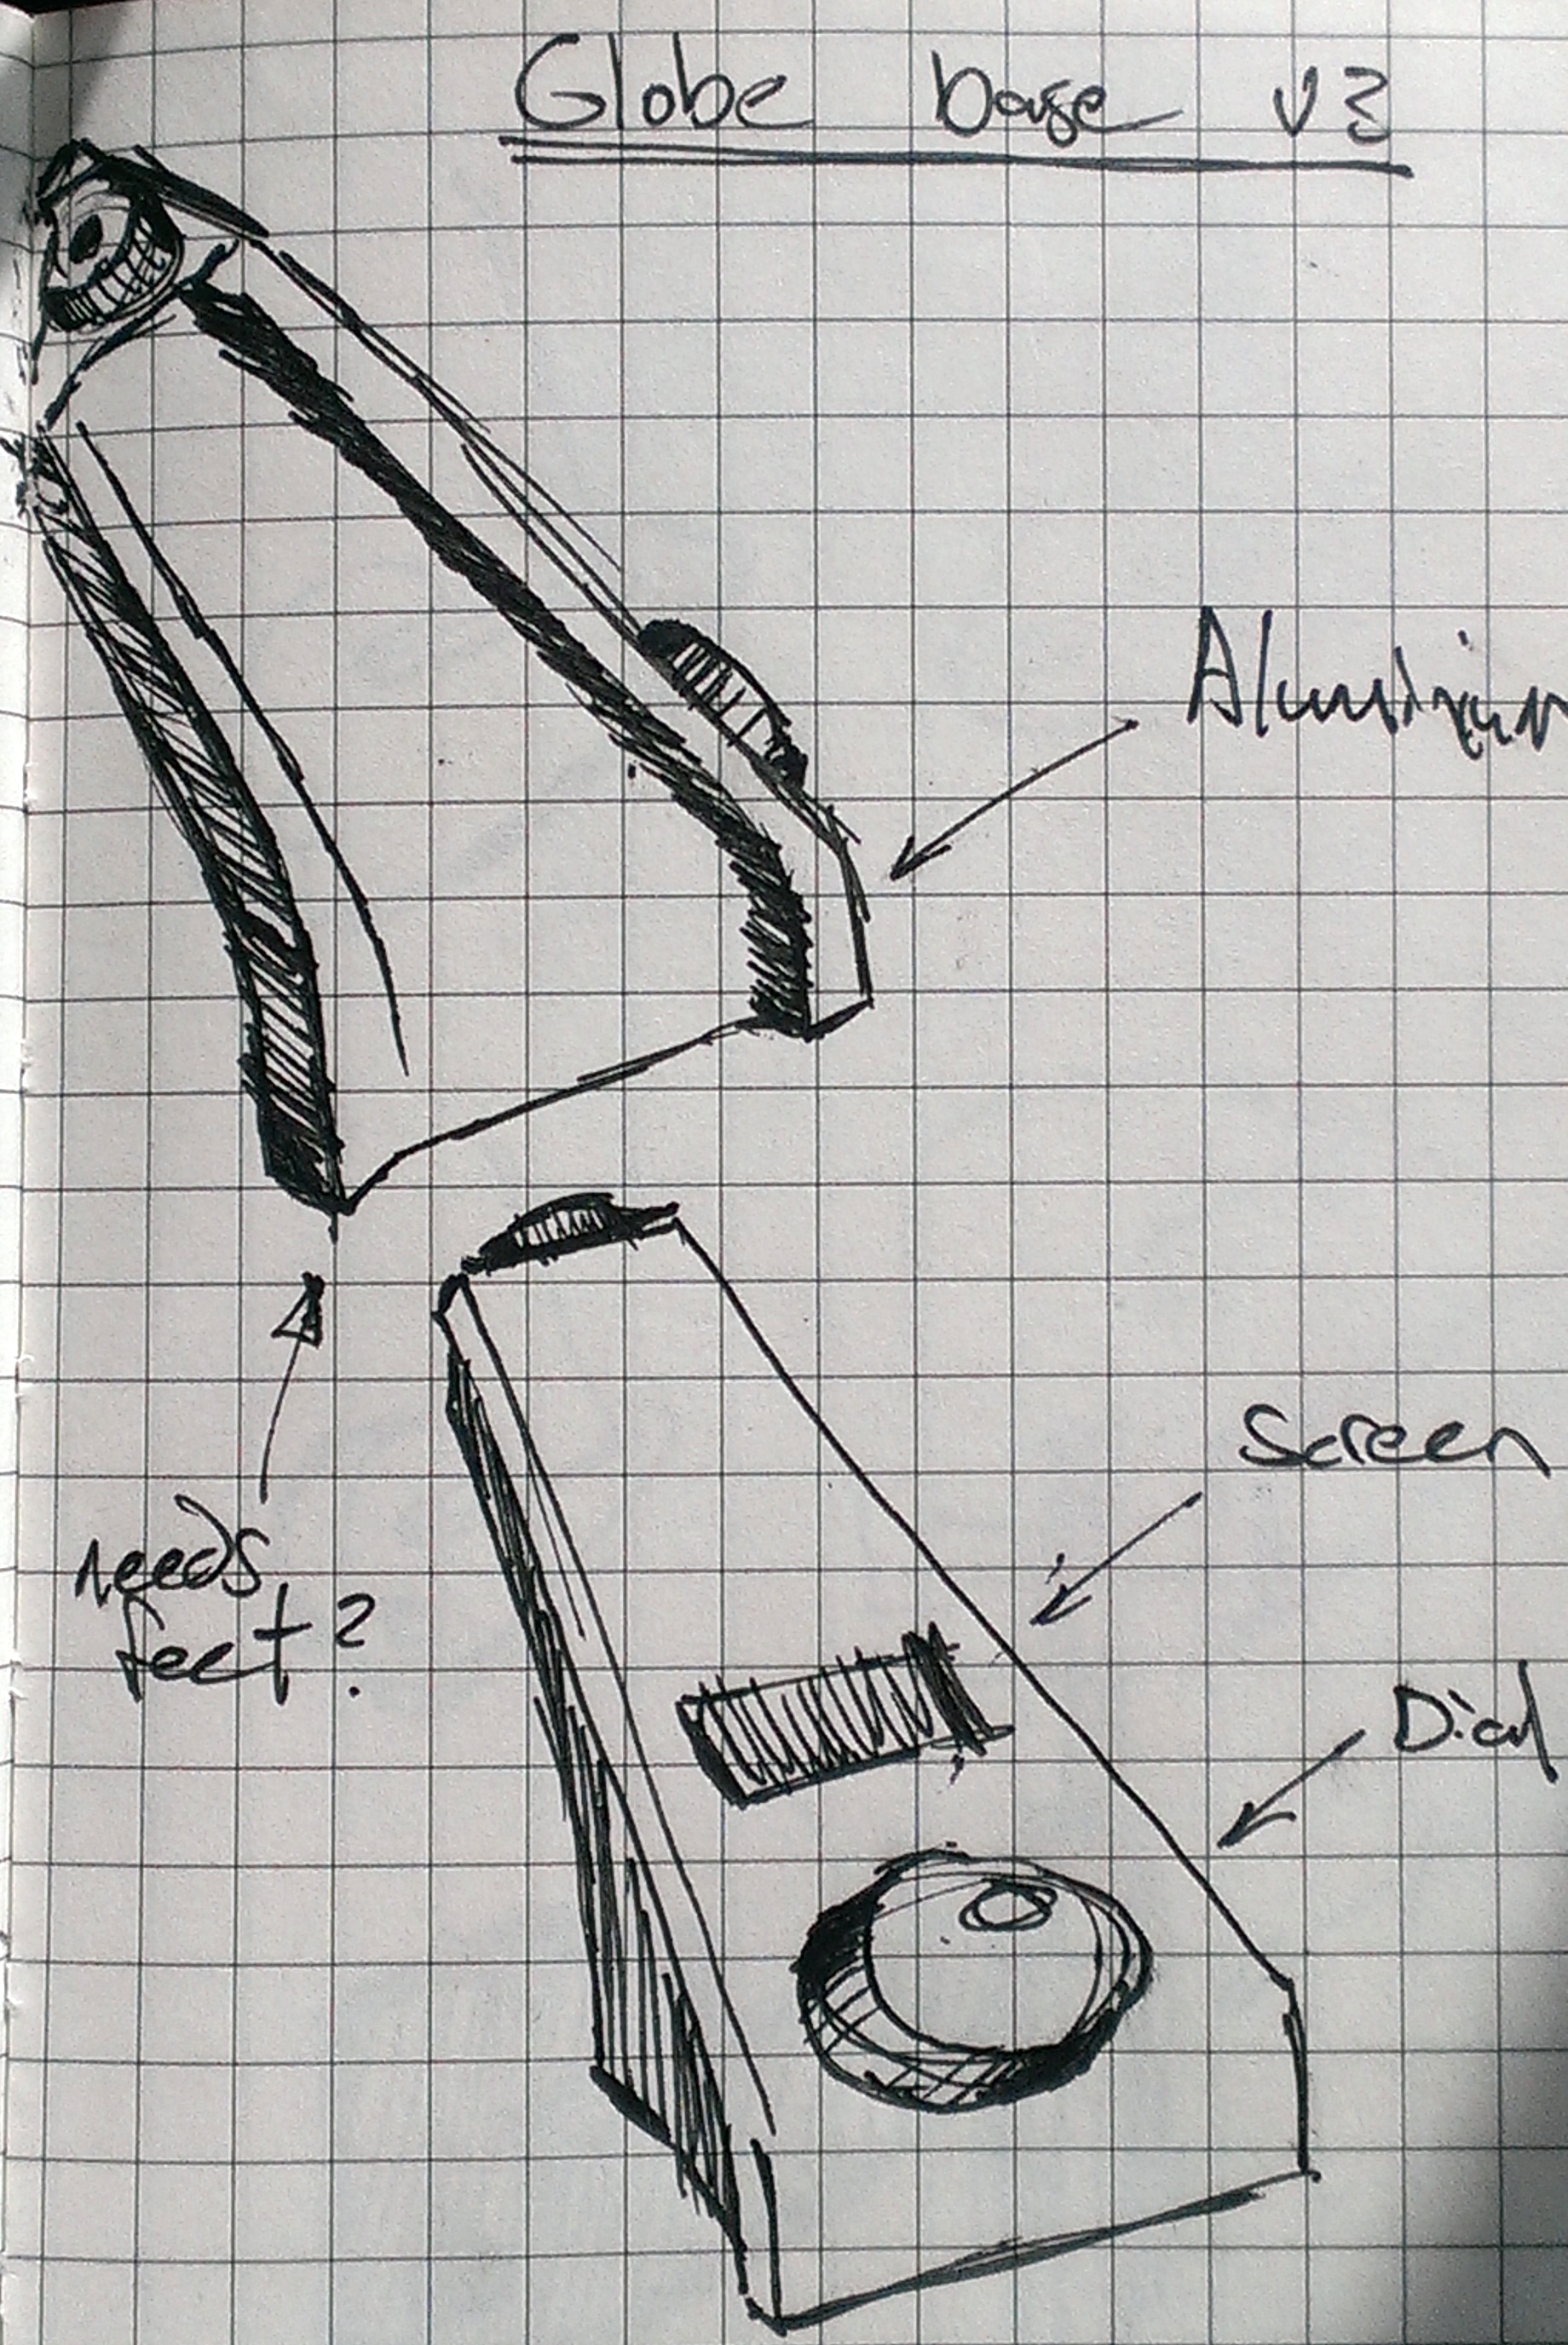
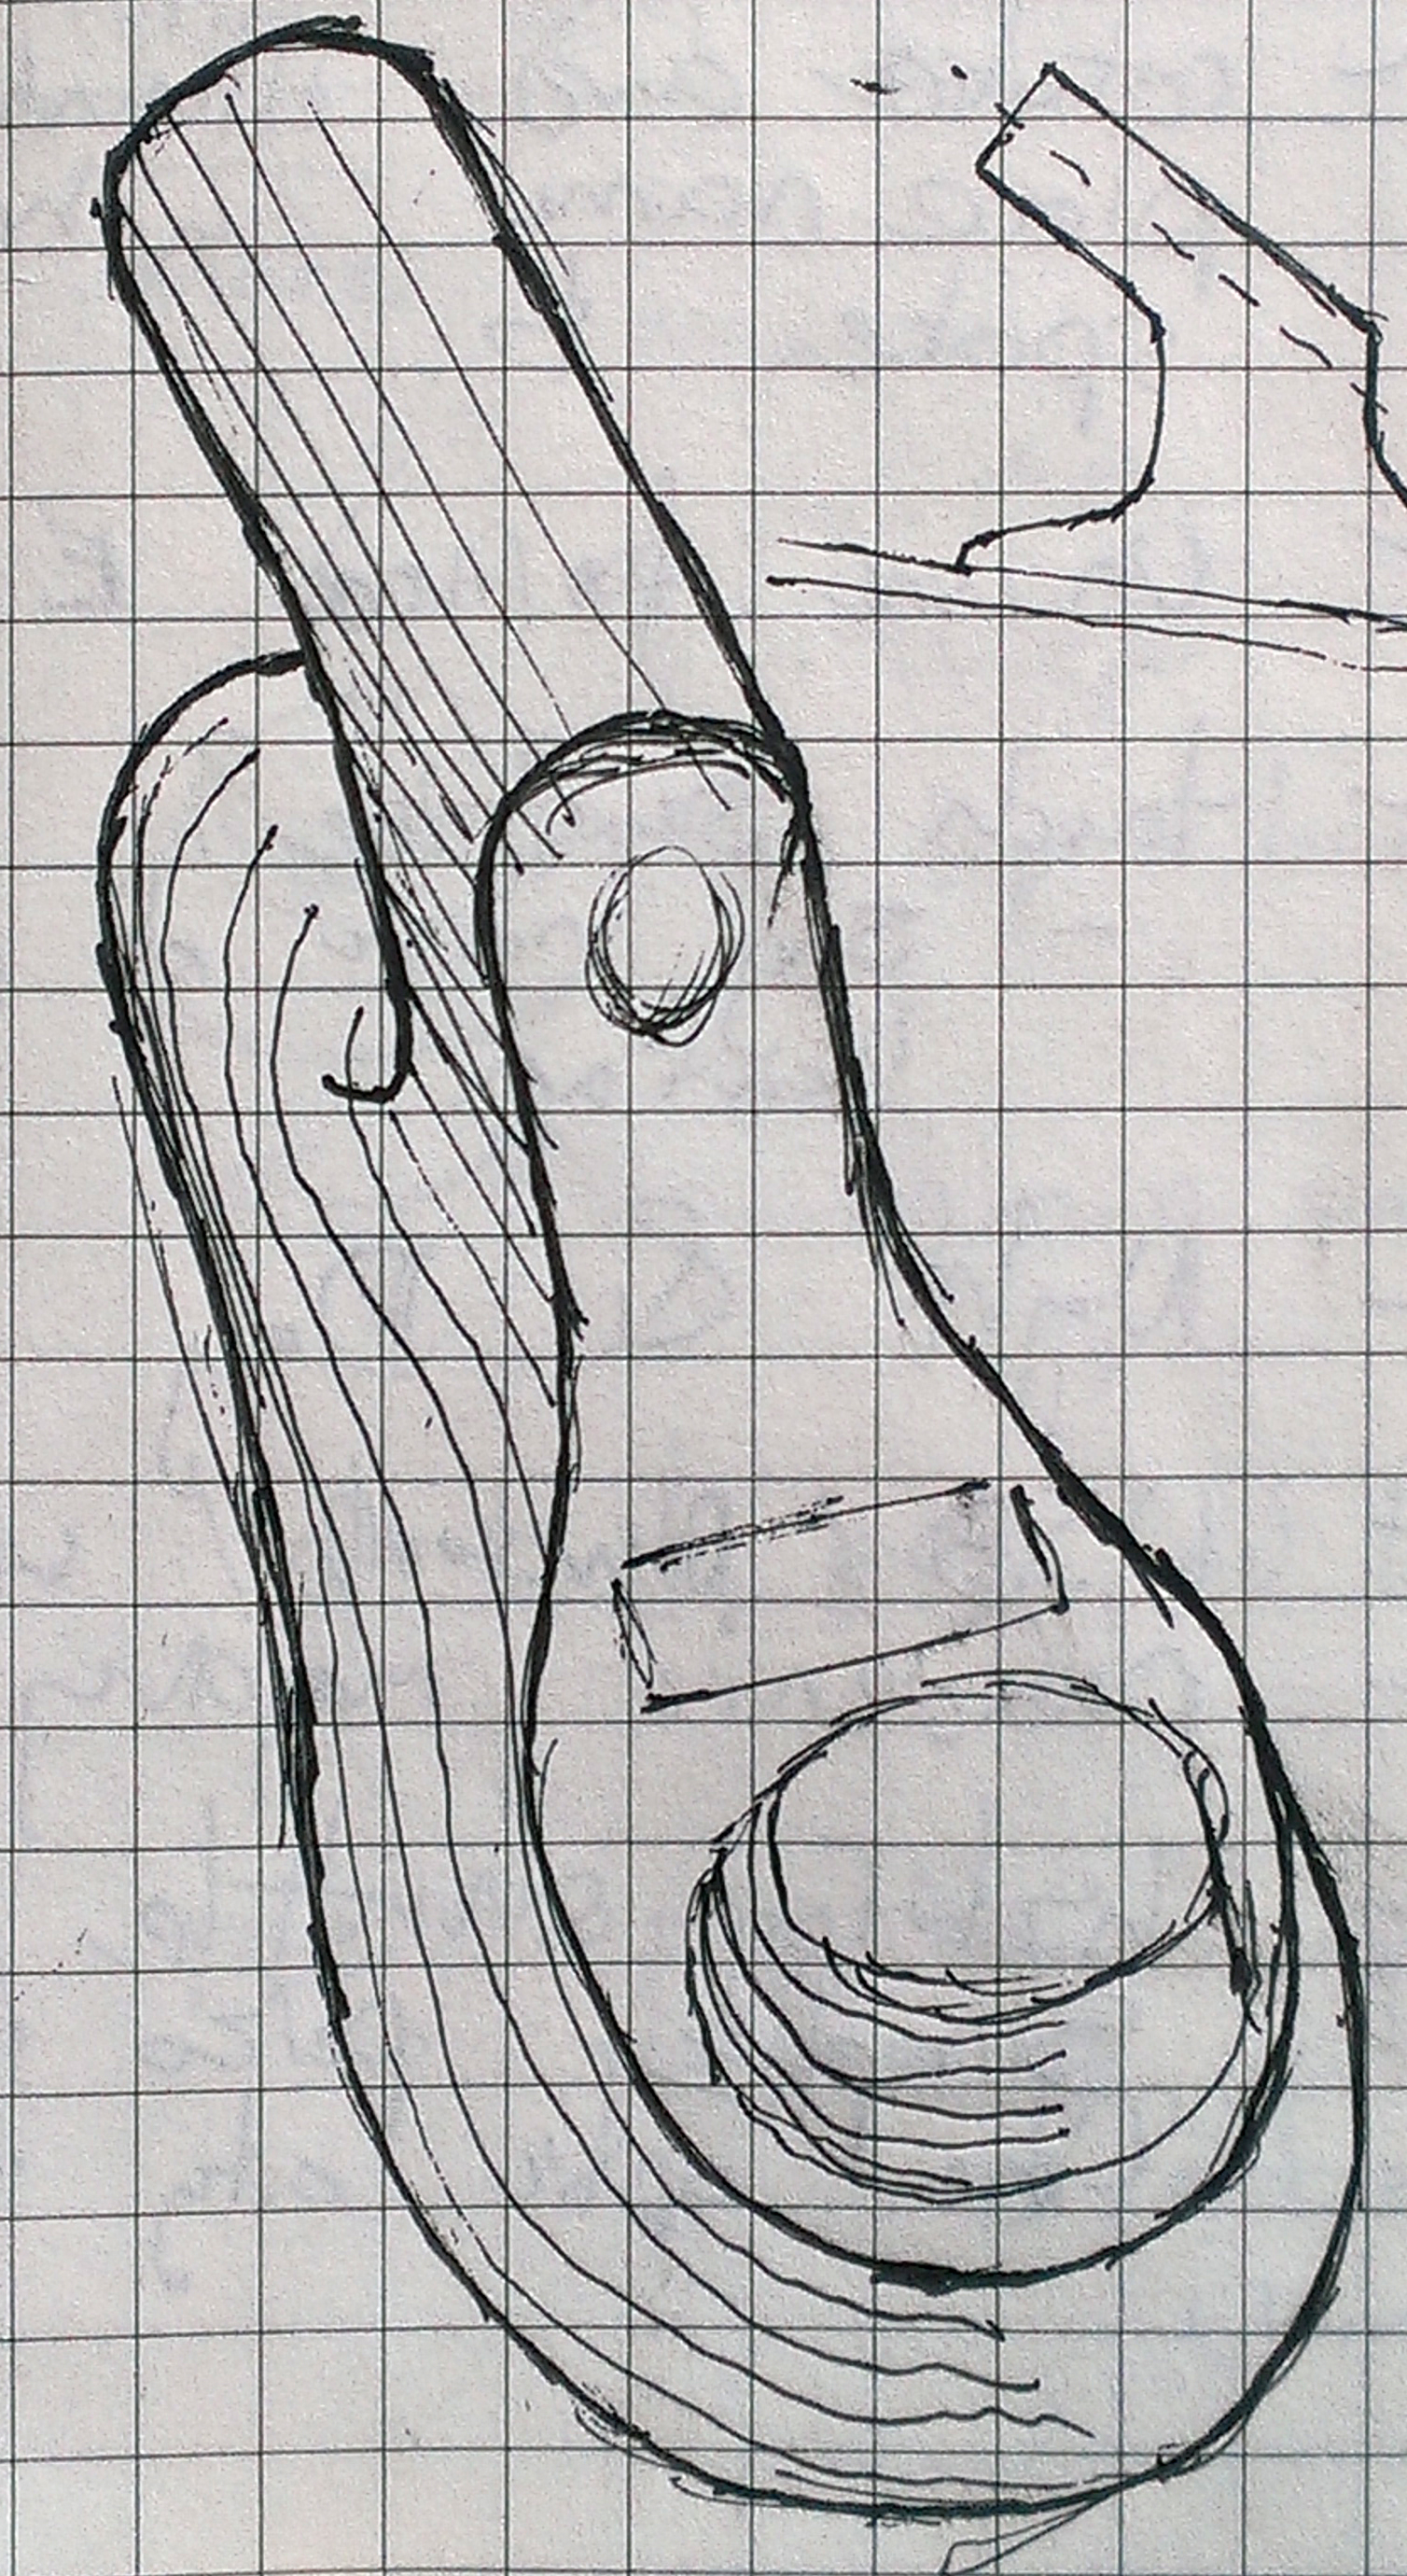
The idea was to create an executive desktop tool/ toy for passively visualising geotagged metrics ie: GDP per capita. Presented as a translucent modern embossed globe with an array of rgb leds illuminating each region.

It would contain its own web server that enables the metrics and colors to be defined, then throughout the day it would just cycle through the predefined data with up to date info from the internet. To make things interesting a holiday roulette option could be run weighting a random selection against climate/ crime/ and average meal prices… In theory it could be excellent, but it would require thousands of leds to illuminate the world with any degree of fidelity. I will simulate it in software and produce a rendered video and see if anyone finds it interesting. till then its on the backburner.


Leave a Reply
You must be logged in to post a comment.